Skip to content ↓
Secure Login
Select Language
Search
Bishop John Robinson C of E Primary School Thamesmead
B
e the best we can.
J
oin in learning, play and prayer.
R
emember God's word.
Menu
Close
Home
About Us
Headteacher's Welcome
Vision and Values
Meet the Team
Governance
Safeguarding Children
Inclusion & PP
Policies
Equality
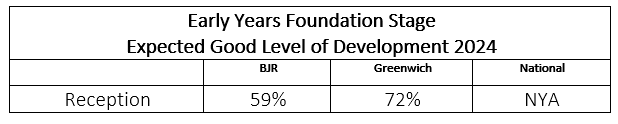
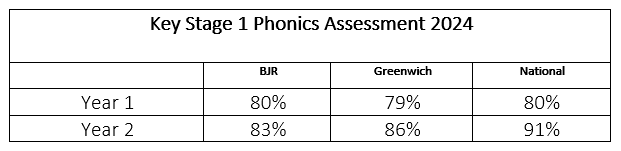
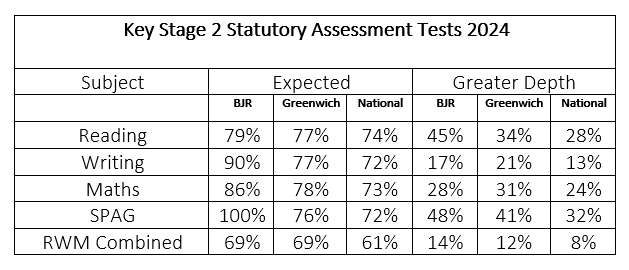
Assessment Data
Inspection reports
Parent Feedback
Our Faith
Collective Worship
Church Links
Leading Lights
Community
Black History 365
Friends of BJR
Green Team
House System
Junior Travel Ambassadors
Positive Parenting
Secondary Transfer
School Maintenance Fund
Information
Admissions
School Clubs
Attendance
Children's Sickness
Finances
Nursery
Remote Learning
Residentials
School Day
School Uniform
Vacancies
News and Events
Celebrating Success
Newsletters
School Calendar
School Council
Term Dates
Letters home
Curriculum
English & Phonics
Mathematics
Religious Education
Science
Early Years
Physical Education
Foundation Subjects
Forest School
PSHE
Classes
School Visits
Contact us
Contact the Office
Complaints
On-Line Payment
Parent Mail
Parent View
Parent Questionnaire
Parent Volunteers
Home
»
About Us
»
Assessment Data
»
Assessment Data
Headteacher's Welcome
Vision and Values
Meet the Team
Governance
Safeguarding Children
Inclusion & PP
Policies
Equality
Assessment Data
Inspection reports
Parent Feedback